Usage
This repository also contains a Jupyter Notebook you can run live and experiment with, courtesy of the Binder project. The notebook can be viewed as a static version using nbviewer.
Basic example
import pyhector

output = pyhector.run(pyhector.rcp26)
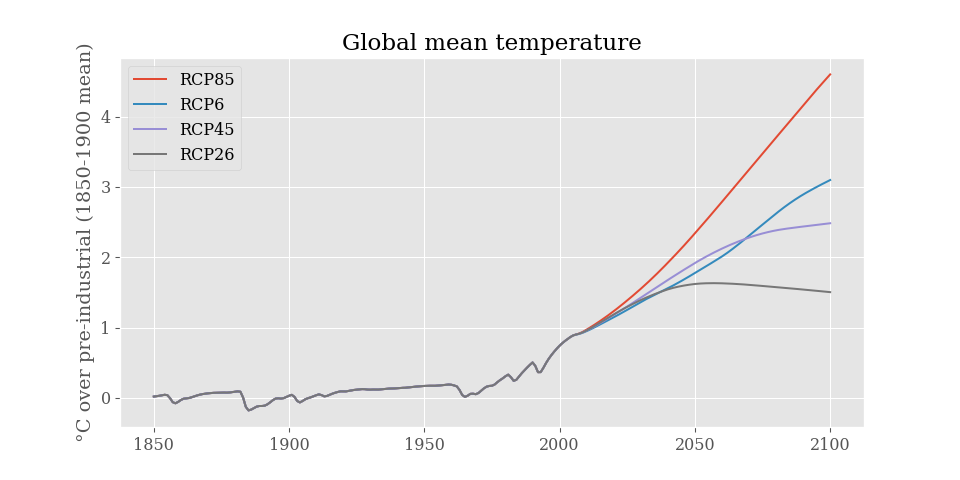
Advanced example
import pyhector
from pyhector import rcp26, rcp45, rcp60, rcp85

import matplotlib.pyplot as plt

for rcp in [rcp26, rcp45, rcp60, rcp85]:
    output = pyhector.run(rcp, {"core": {"endDate": 2100}})
    temp = output["temperature.Tgav"]
    # Adjust to 1850 - 1900 reference period
    temp = temp.loc[1850:] - temp.loc[1850:1900].mean()
    temp.plot(label=rcp.name.split("_")[0])
plt.title("Global mean temperature")
plt.ylabel("°C over pre-industrial (1850-1900 mean)")
plt.legend(loc="best")
plt.show()